In today’s business environment, firms are surrounded by an overwhelming amount of information. The challenge? Being able to make sense of that ocean of information. Welcome to the business analytics dashboard, which companies utilize to analyze their information.
However, what it is that a dashboard contributes and why a business, apart from the ones mentioned above, thinks of employing one remains the next question. Here are some of the benefits of using a business analytics dashboard and how it can change your business processes for the better.

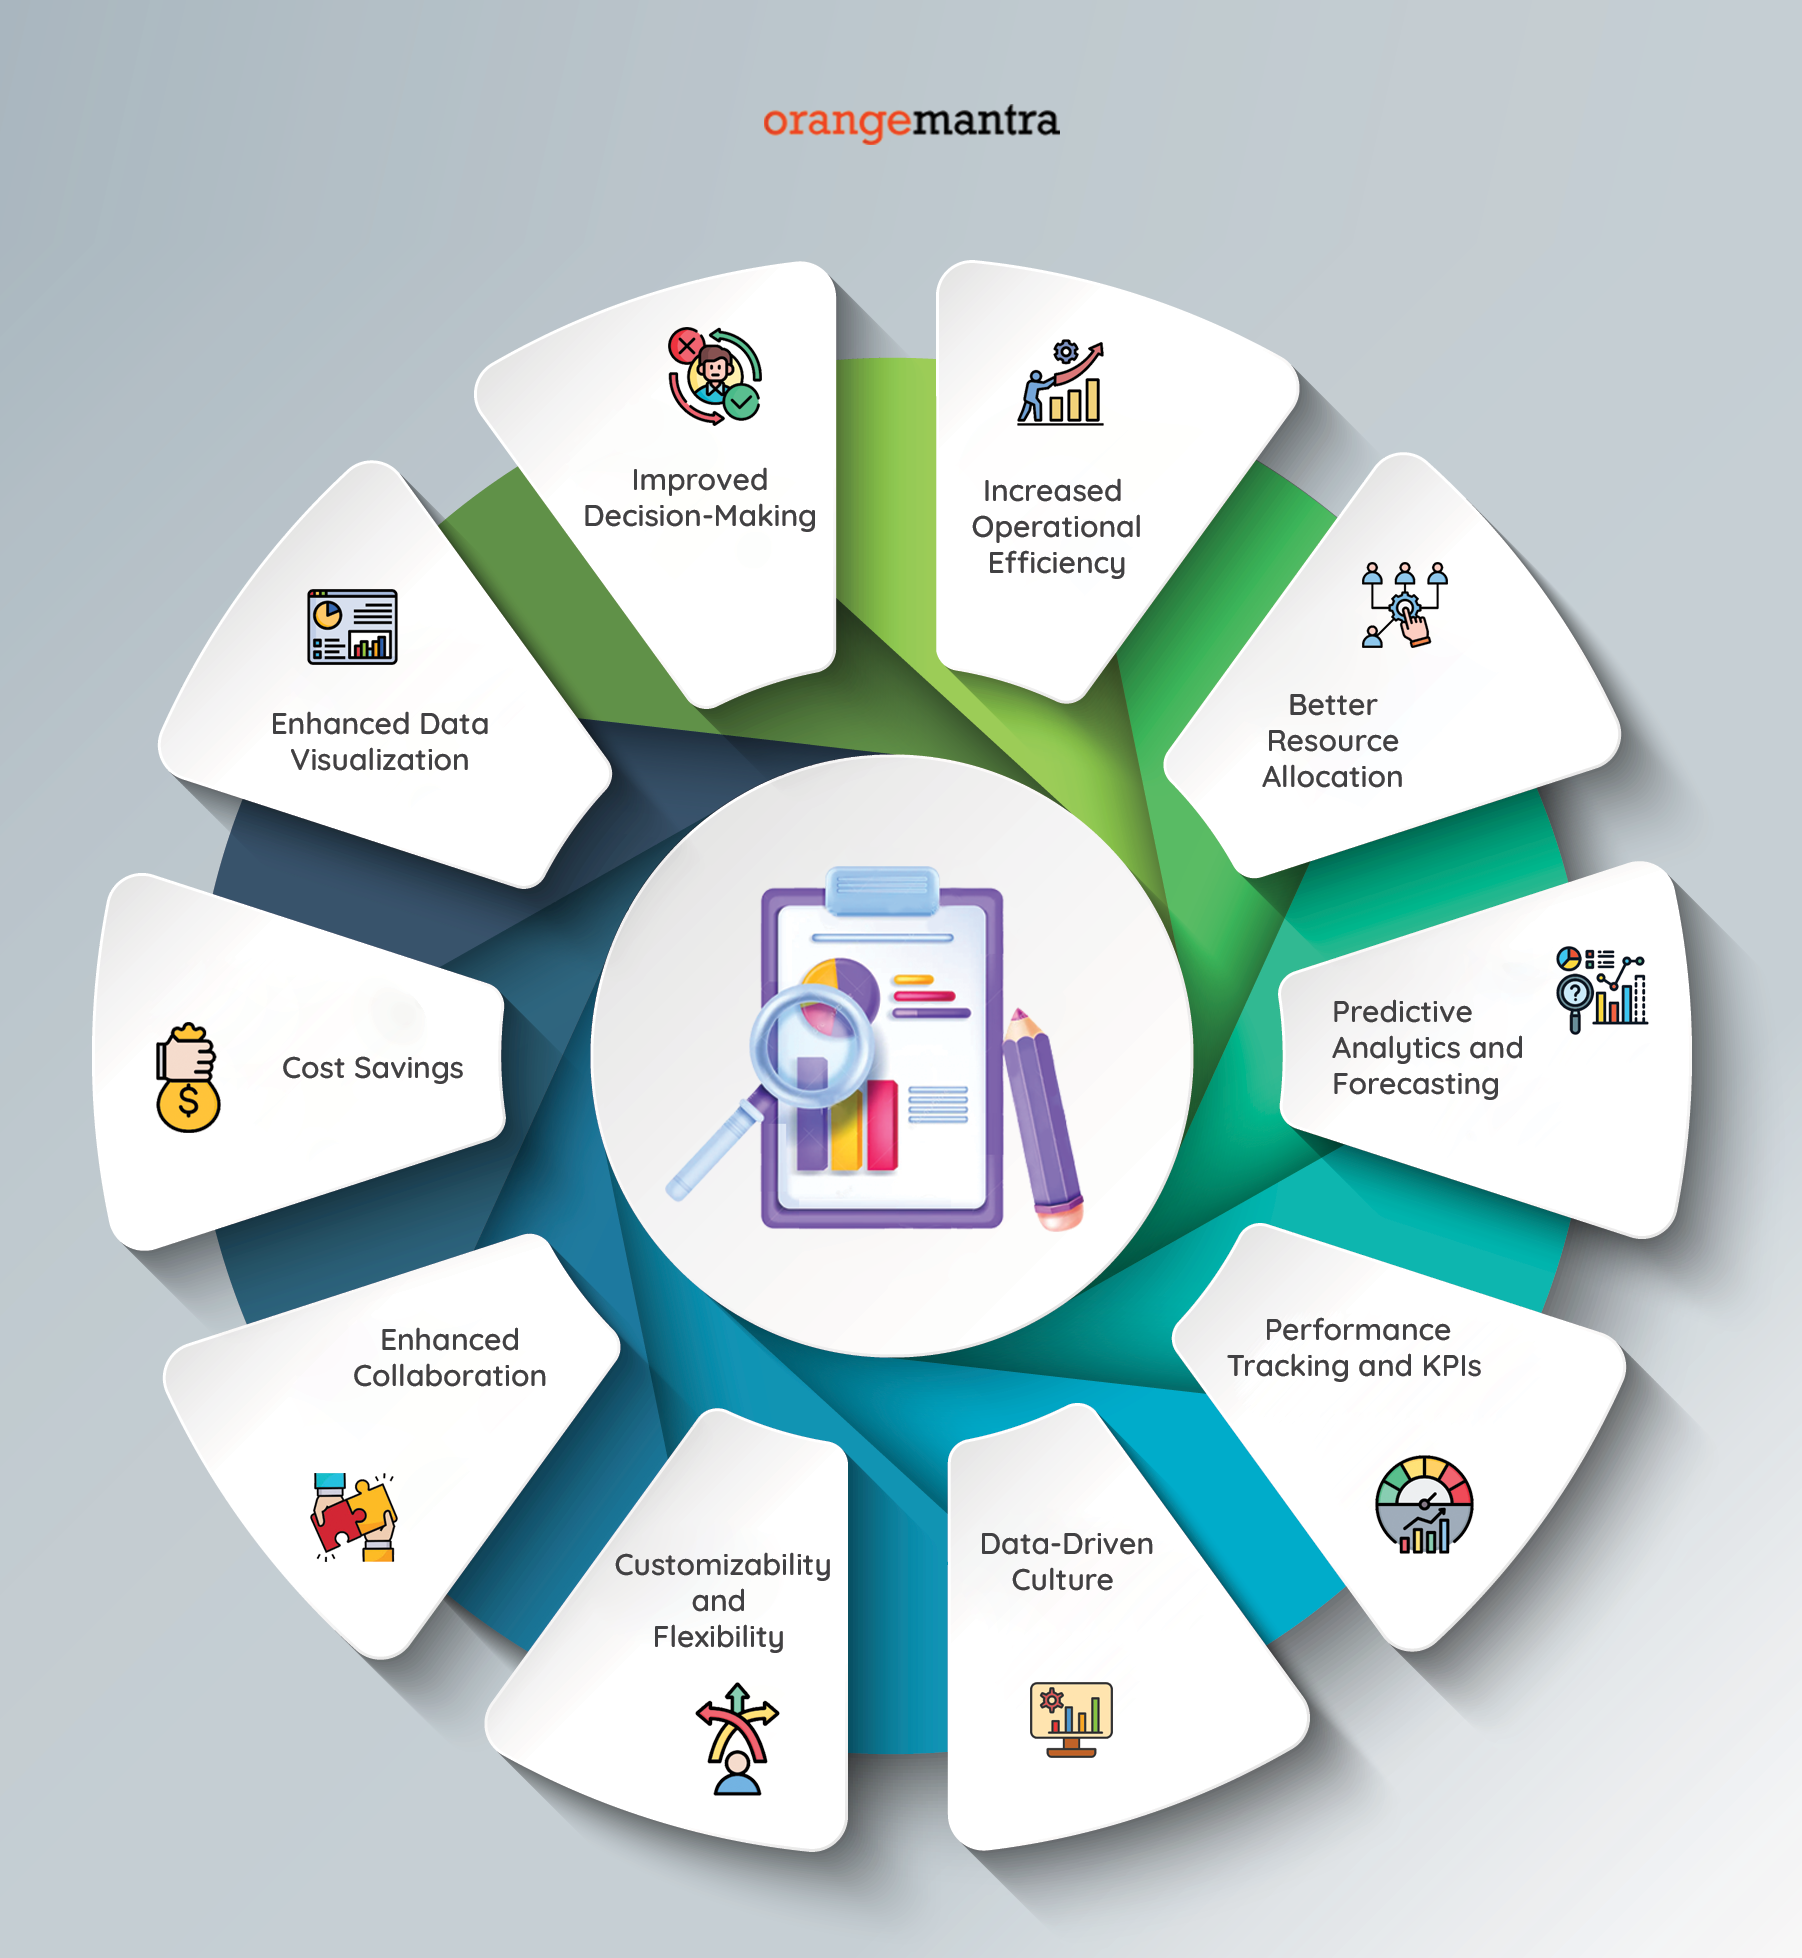
Enhanced Data Visualization
Picture yourself being able to understand an exam paper with thousands of columns of data. This is where business analytics dashboards come into play – they take stocks and make them encompass able in the form of a dashboard solution.
In other words, charts, graphs and other similar tools help to simplify the presentation of large sets of information. Instead of looking for yourself at the endless sea of figures, you directly view your data at once. It also becomes much easier to spot trends, patterns or even outliers and, in essence, make better decisions immediately.
For instance, a marketing manager can easily know the status of a certain campaign by looking at the conversion rates, the level of engagement by the customers among other factors displayed on a dashboard. One doesn’t have to cruise through rows of data—data is displayed in the most sophisticated manner possible.
Improved Decision-Making
Decisions form the essence of the business world. But what happens when those decisions are made without enough insight? More often than not, the answer is inefficiency and, almost invariably, failure. A business analytics dashboard solution makes the decision-making process to be more informed.
The first advantage is that, as with any other standard dashboard, one gets real-time data to work with the most up-to-date information possible. Whether it be in sales, stock, or customers, having data readily available means you can respond and make the right decisions.
Suppose a particular product is declining in the marking; the dashboard stores you early enough on the issue. It can help you decide to run a promotion or change the marketing strategy, which may help to save a product that is about to be discontinued.
Increased Operational Efficiency
It does not take a genius to realize that data crunching manually is something no one wants to do. Sometimes the process of accumulating and arranging information from different sources is literally time-consuming work, which takes hours or even days. Business analytics dashboards simplify this kind of task and provide a single window that usually combines data from various departments or applications.
Instead of spending a lot of time compiling reports, with the help of automation, your team can analyze the data and respond to it. The result? A significant rise in the production rate.
- Try to picture yourself managing a company where all the different corporations in it have the same updated data.
- They can talk to each other; sales can speak to marketing, and operations can be in tandem with finance instantly.
- Work becomes more efficient because there is never a need for someone to be waiting on a report that is still old or data that was collected in a format that cannot be understood.
Better Resource Allocation
Resource management is one of the most important aspects of managing a business organization. When it comes to manpower, budget, and equipment, miscalculations or poor distribution of the same are expensive. When using business analytic dashboards, it is easier to tell where resources are scarce or overused.
You can monitor workers’ output or the number of stocks systematically in real-time. Perhaps a certain team is doing poorly, or an area of the business is oversaturated with funding; at least you are confident that changes can be made swiftly.
In a retail setting, this may mean, for instance, having to shift personnel around at certain points so that there are no traffic jams or developing a better way of ordering stock so as to meet the client’s needs.
Predictive Analytics and Forecasting
A current attractive property of these tools is that most of the modern dashboards can predict future trends. With predictive analytics, a business can foresee movements within a given market, behavioral changes among its customers, or cuts within its company.
- Dashboards can also build models based on historical data that will predict outcomes in the future.
- You can plan fully knowing that all the factors that are going to affect your plan will be taken into consideration.
To elaborate, with forecasting, you are always taking a step forward, be it when it comes to increasing or decreasing stocks depending on the upcoming season, or when preparing for a possible decline in customer traffic. With such knowledge, you can change your marketing campaign or stock status, making you more suited to making profits.
Performance Tracking and KPIs
KPIs, commonly known as key performance indicators, are the pulse of any business. They provide information on your company’s performance and whether or not it is achieving its objectives. This way, with business analytics dashboards, users can have the scores of the respective KPIs visible and up to date in real-time.
- Instead of waiting to get an analysis at the end of the quarter, you can know, as you are, this week or this month.
- There are also options to set the alerts or thresholds—you want a certain KPI, and if it goes below a level, you would like an alert.
- It allows for getting in front of changes rather than having to fix things that are wrong or have gotten off course.
For instance, in sales, metrics such as lead conversion ratio, or even month-to-month sales increases are so easy to follow. By the time you see a negative trend in the number of people converting, you can adjust something and get it back in the positive again.
Data-Driven Culture
Implementing business analytics dashboards can lead to a change in organizational culture toward data utilization. Once all employees are connected to data, it makes them empowered to make decisions that are data-driven as opposed to guessing.
- It demonstrates how team members are performing to the specific goals of the company.
- It also fosters teamwork since data is passed across teams, making everyone work towards a common vision and goal.
- This figure shows precisely how the work of a sales team is tied to the revenue of the entire company.
This allows them to modify the directions in the field, which means better performance, and more responsibility from specific team members.
Customizability and Flexibility
Every company is unique, so a generic dashboard solution just won’t do. Metrics can be kept simple and granular to suit the business’s need or be very complex with a lot of details for the benefit of the executive teams.
Regardless of what type of industry—from retail to healthcare to manufacturing—you can customize your dashboard based on the performance indicators you deem most important for your enterprise.
- It is often the case that some organizations target sales performance, whereas others might aim at supply chain management and customer satisfaction.
- Dashboards are flexible, as they will allow you to track exactly what you need to know.
For example, the healthcare provider will include such metrics as patient waiting time and staffing levels on his or her dashboard, while the big data analytics company will monitor the product development timelines and customers’ satisfaction correspondingly.
Enhanced Collaboration
The need for collaboration is met in a data-rich environment, and therefore it will be easier to accomplish. power bi development company help make it easy to disseminate knowledge and information to other teams or across departments. Siloed data has become a thing of the past, as we are all working with the same information now.
- Integration is another concept in project management since, usually, teams from different departments have to collaborate to meet business objectives.
- Using dashboards, they can see it in real-time, work through it as a team, and make decisions cooperatively.
- The marketing group may decide to share certain results of a campaign with the sales team so that they can be in a position to help come up with a better strategy.
This concept is important since there will be a common ground through which all or most of the team is acquainted with the platform better, thereby increasing the likelihood of the outcome of collaboration.
Cost Savings
Afterward, all these businesses have one common goal, and that is profile applications of business analytics dashboards point towards the idea that efficiency can be increased, the cost of the process reduced, and instantaneous and accurate decisions can be made.
- Data collection and reporting thus become less time-consuming and therefore resource-consuming and thus could be channeled to other fruitful lanes.
- Real-time information helps managers to react swiftly to such scenarios as stockpiling or expending too much on marketing efforts.
- A manufacturing company will have a dashboard that shows the efficiency of production.
- It allows them to locate constraints that perform well below par regions and change ways that result in the scrapping of assets, time, and coinage.
Concluding Thoughts
Business analytics have become a significant asset in the way that businesses operate and manage data and the default way through which firms attempt to reduce costs and increase productivity.
- The advantages of applying the approach include creating accurate visual representations of large amounts of data and monitoring performance in real-time.
- In today’s rapidly running business environment, sometimes the basic integral information that one needs instantly can make or mar the situation.
- If you don’t currently have a business analytics dashboard, then perhaps now is a good time to begin looking at what is out there.
FAQs
What is a business analytics dashboard, and how does it differ from traditional reporting?
A business analytics dashboard is an aggregate of multiple bits of data that is put together in an easily understandable format for the users and is updated in real-time. Unlike conventional reporting that relies on preparing standard fixed reports at a given interval (say, monthly or quarterly), dashboards offer constantly updated, even real-time information. They enable users to engage with the information and to filter to more detailed data, as well as to render it in the most convenient way.
How can a business analytics dashboard improve decision-making?
Dashboards play a significant role in helping business firms make the right decisions through timely provision of data together with easy-to-understand visual displays. Instead of going through the original data or the simple documents for summary reports, the decision makers can easily see patterns, generate alerts, and monitor organizational performance against the set benchmarks. It also allows them to work faster and be more accurate in their decision making as they fully understand the market and trends.
Can a business analytics dashboard be customized to meet specific industry needs?
Oh indeed, in fact, this is one of the greatest advantages of a , it is fully customizable. Common to all industries, the KPIs in dashboards can also be customized according to specific industries such as retail, healthcare, finance, and manufacturing. For instance, a retail firm may have to monitor the number of sales and customers’ buying behaviour, while a healthcare firm may have to monitor the time of patients waiting and the number of staff members on duty.


